Census Lists and Graphs
The census records took two main forms between 1820 and 1870. The first form, used between 1820 and 1840, primarily recorded the head of house and the number of individuals within the home based on specific age ranges.
Beginning in 1850, the census records started asking for the names of all residents, age, sex, race, occupation, value of real estate, value of personal estate, occupation, and in some cases level of education.
Below are a series of graphs displaying:
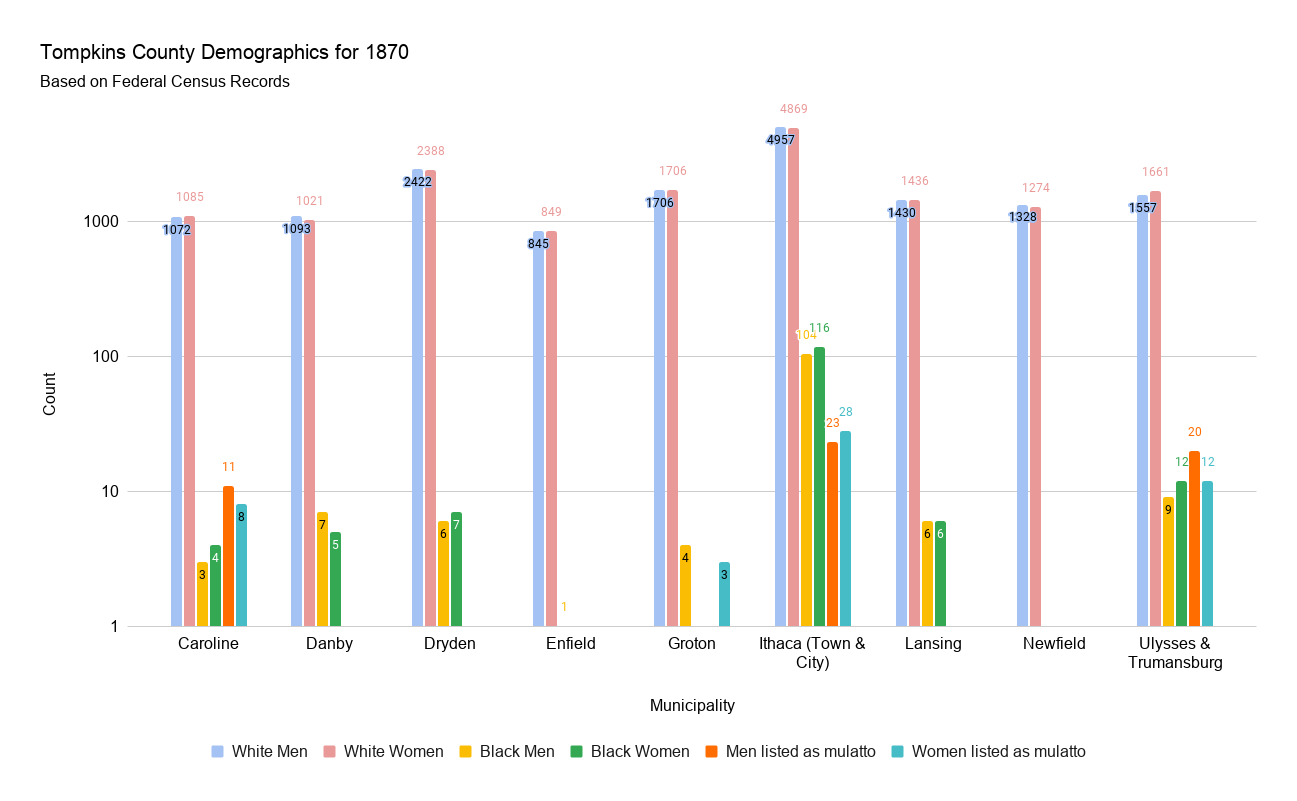
Each municipality’s demographics between 1820 & 1870
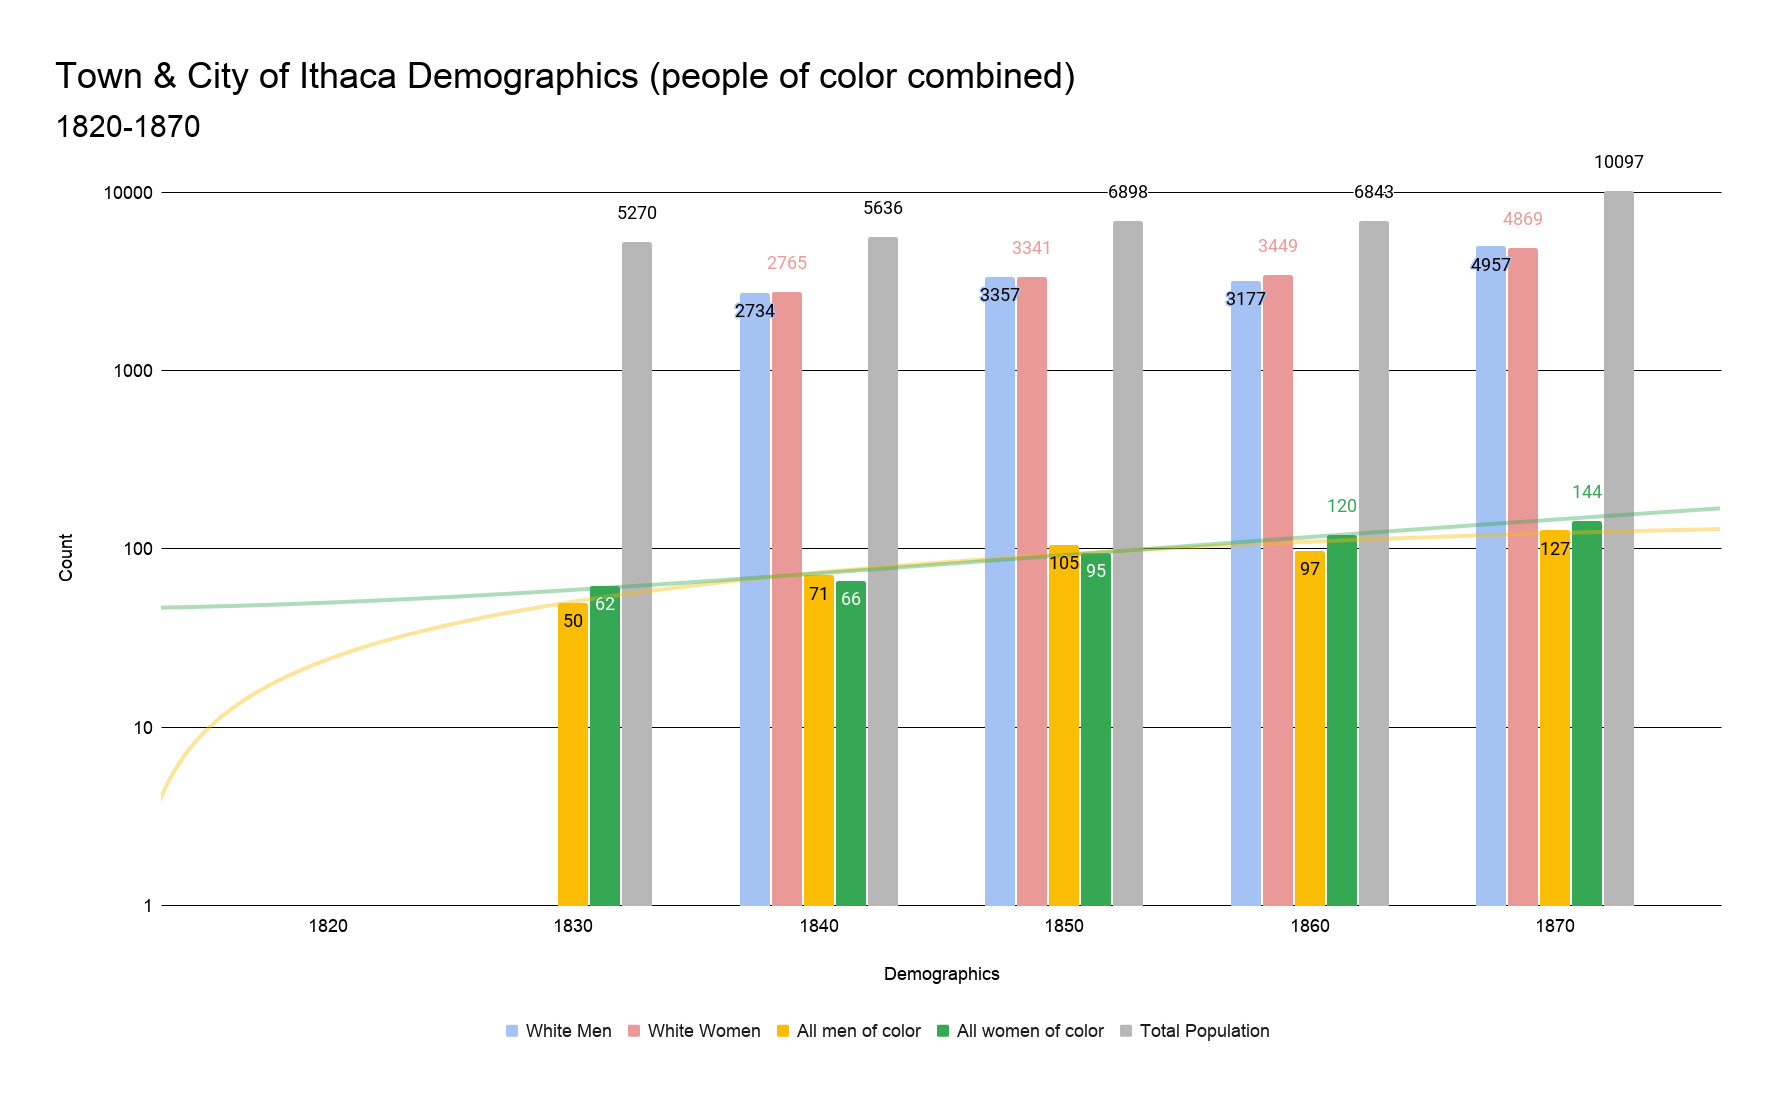
The black population’s growth in Ithaca between 1830 & 1870
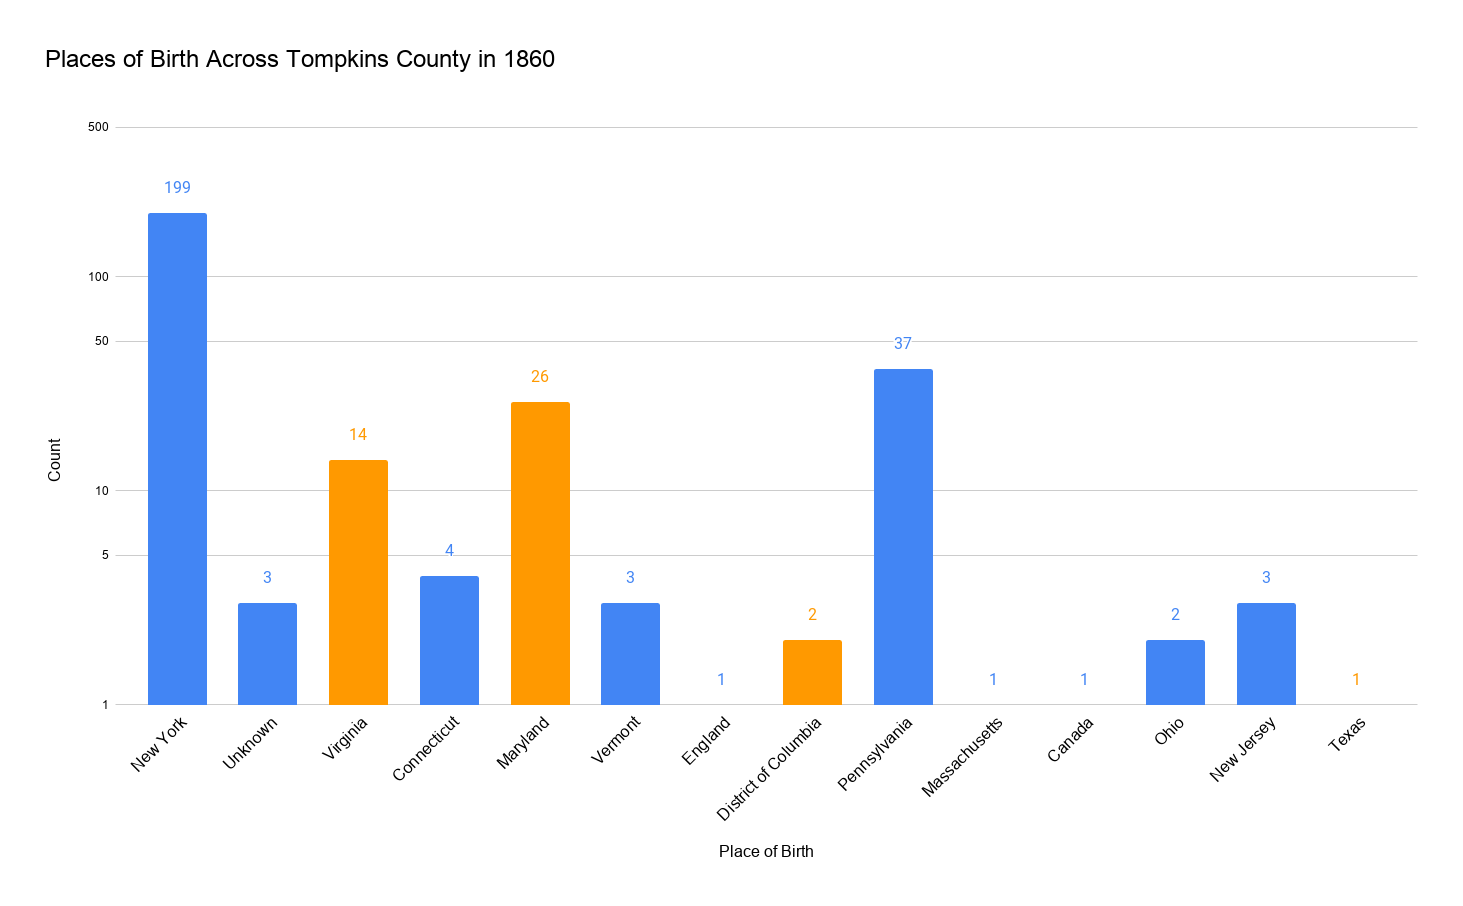
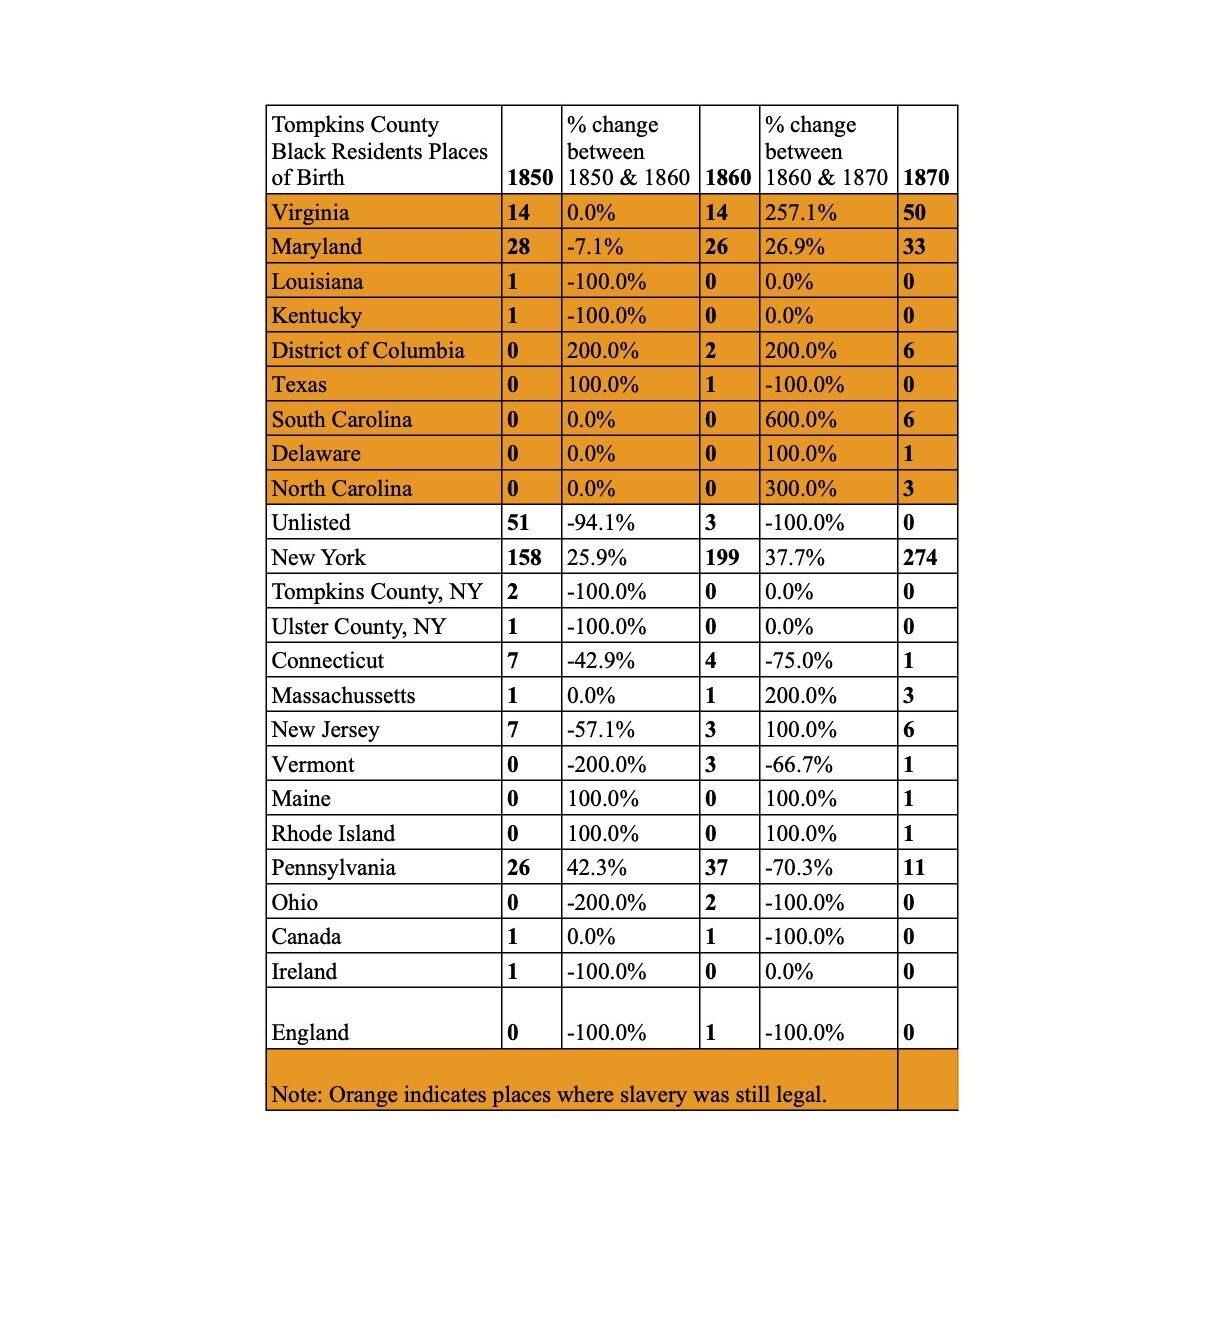
The birthplaces of black residents across Tompkins County between 1850 & 1870
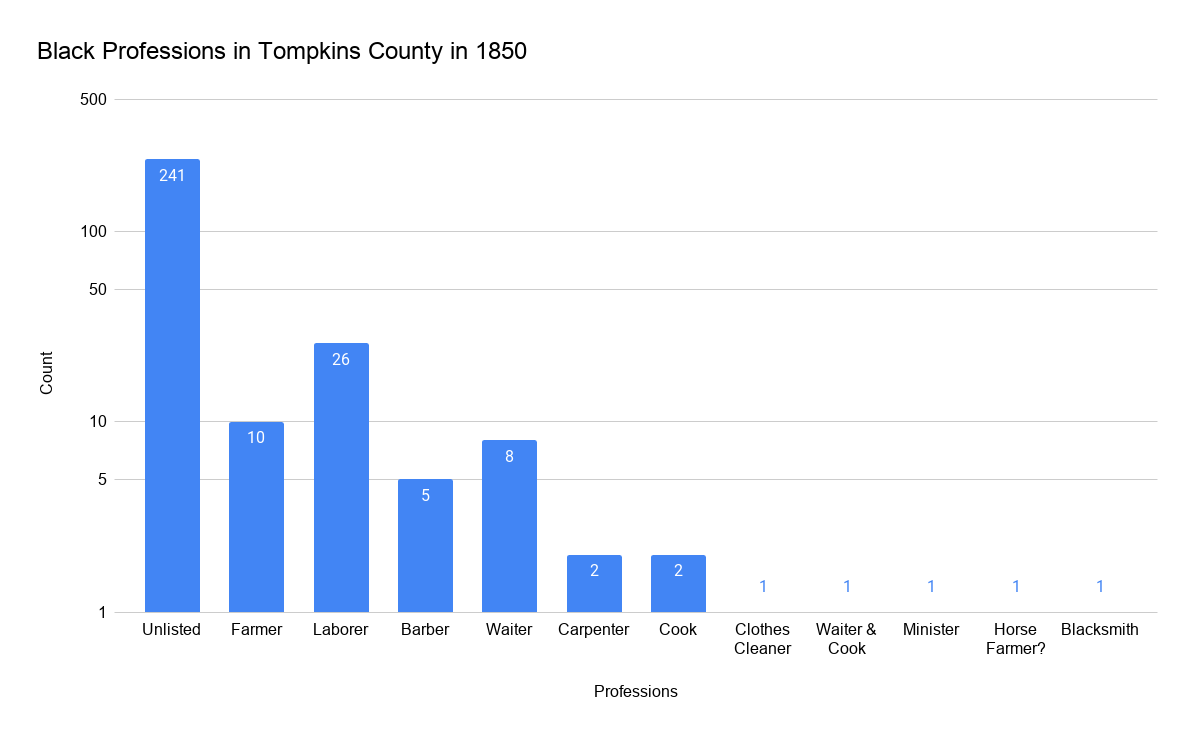
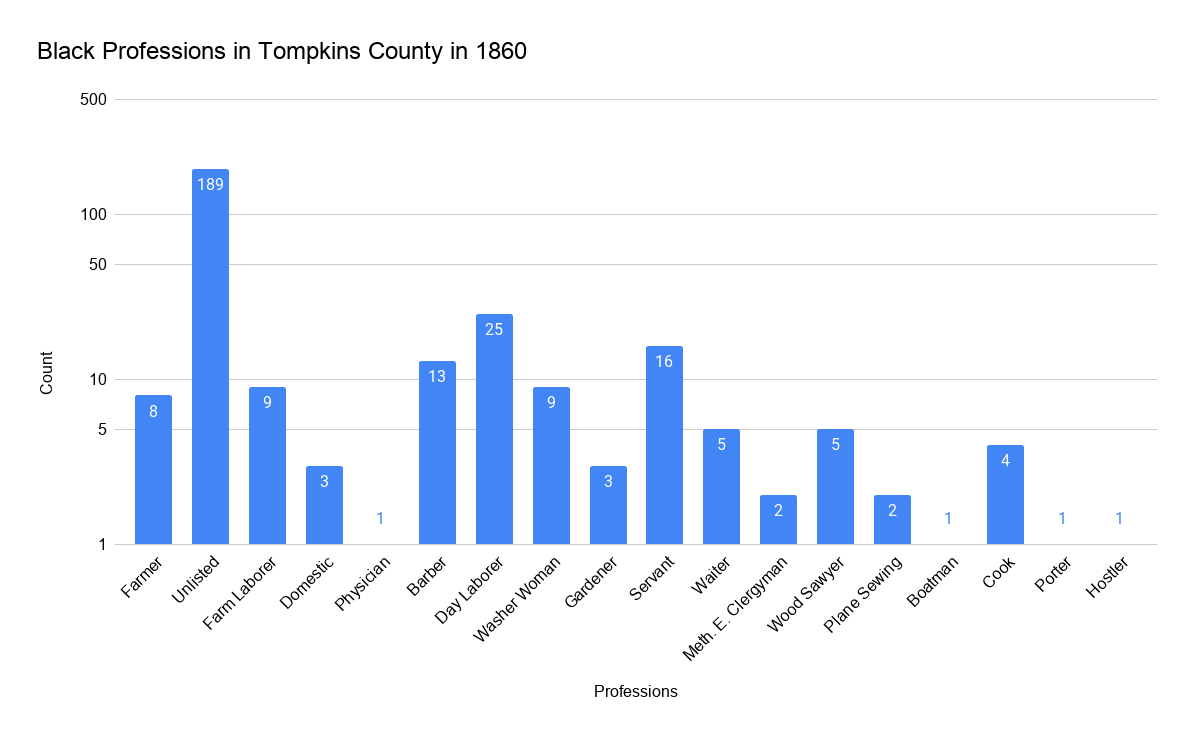
Black occupations across Tompkins County between 1850 & 1870
Note: The Y-axis (vertical) of each graph on this page uses a logarithmic scale.
To access the census lists that provided that data for these graphs, please navigate to the Census page.
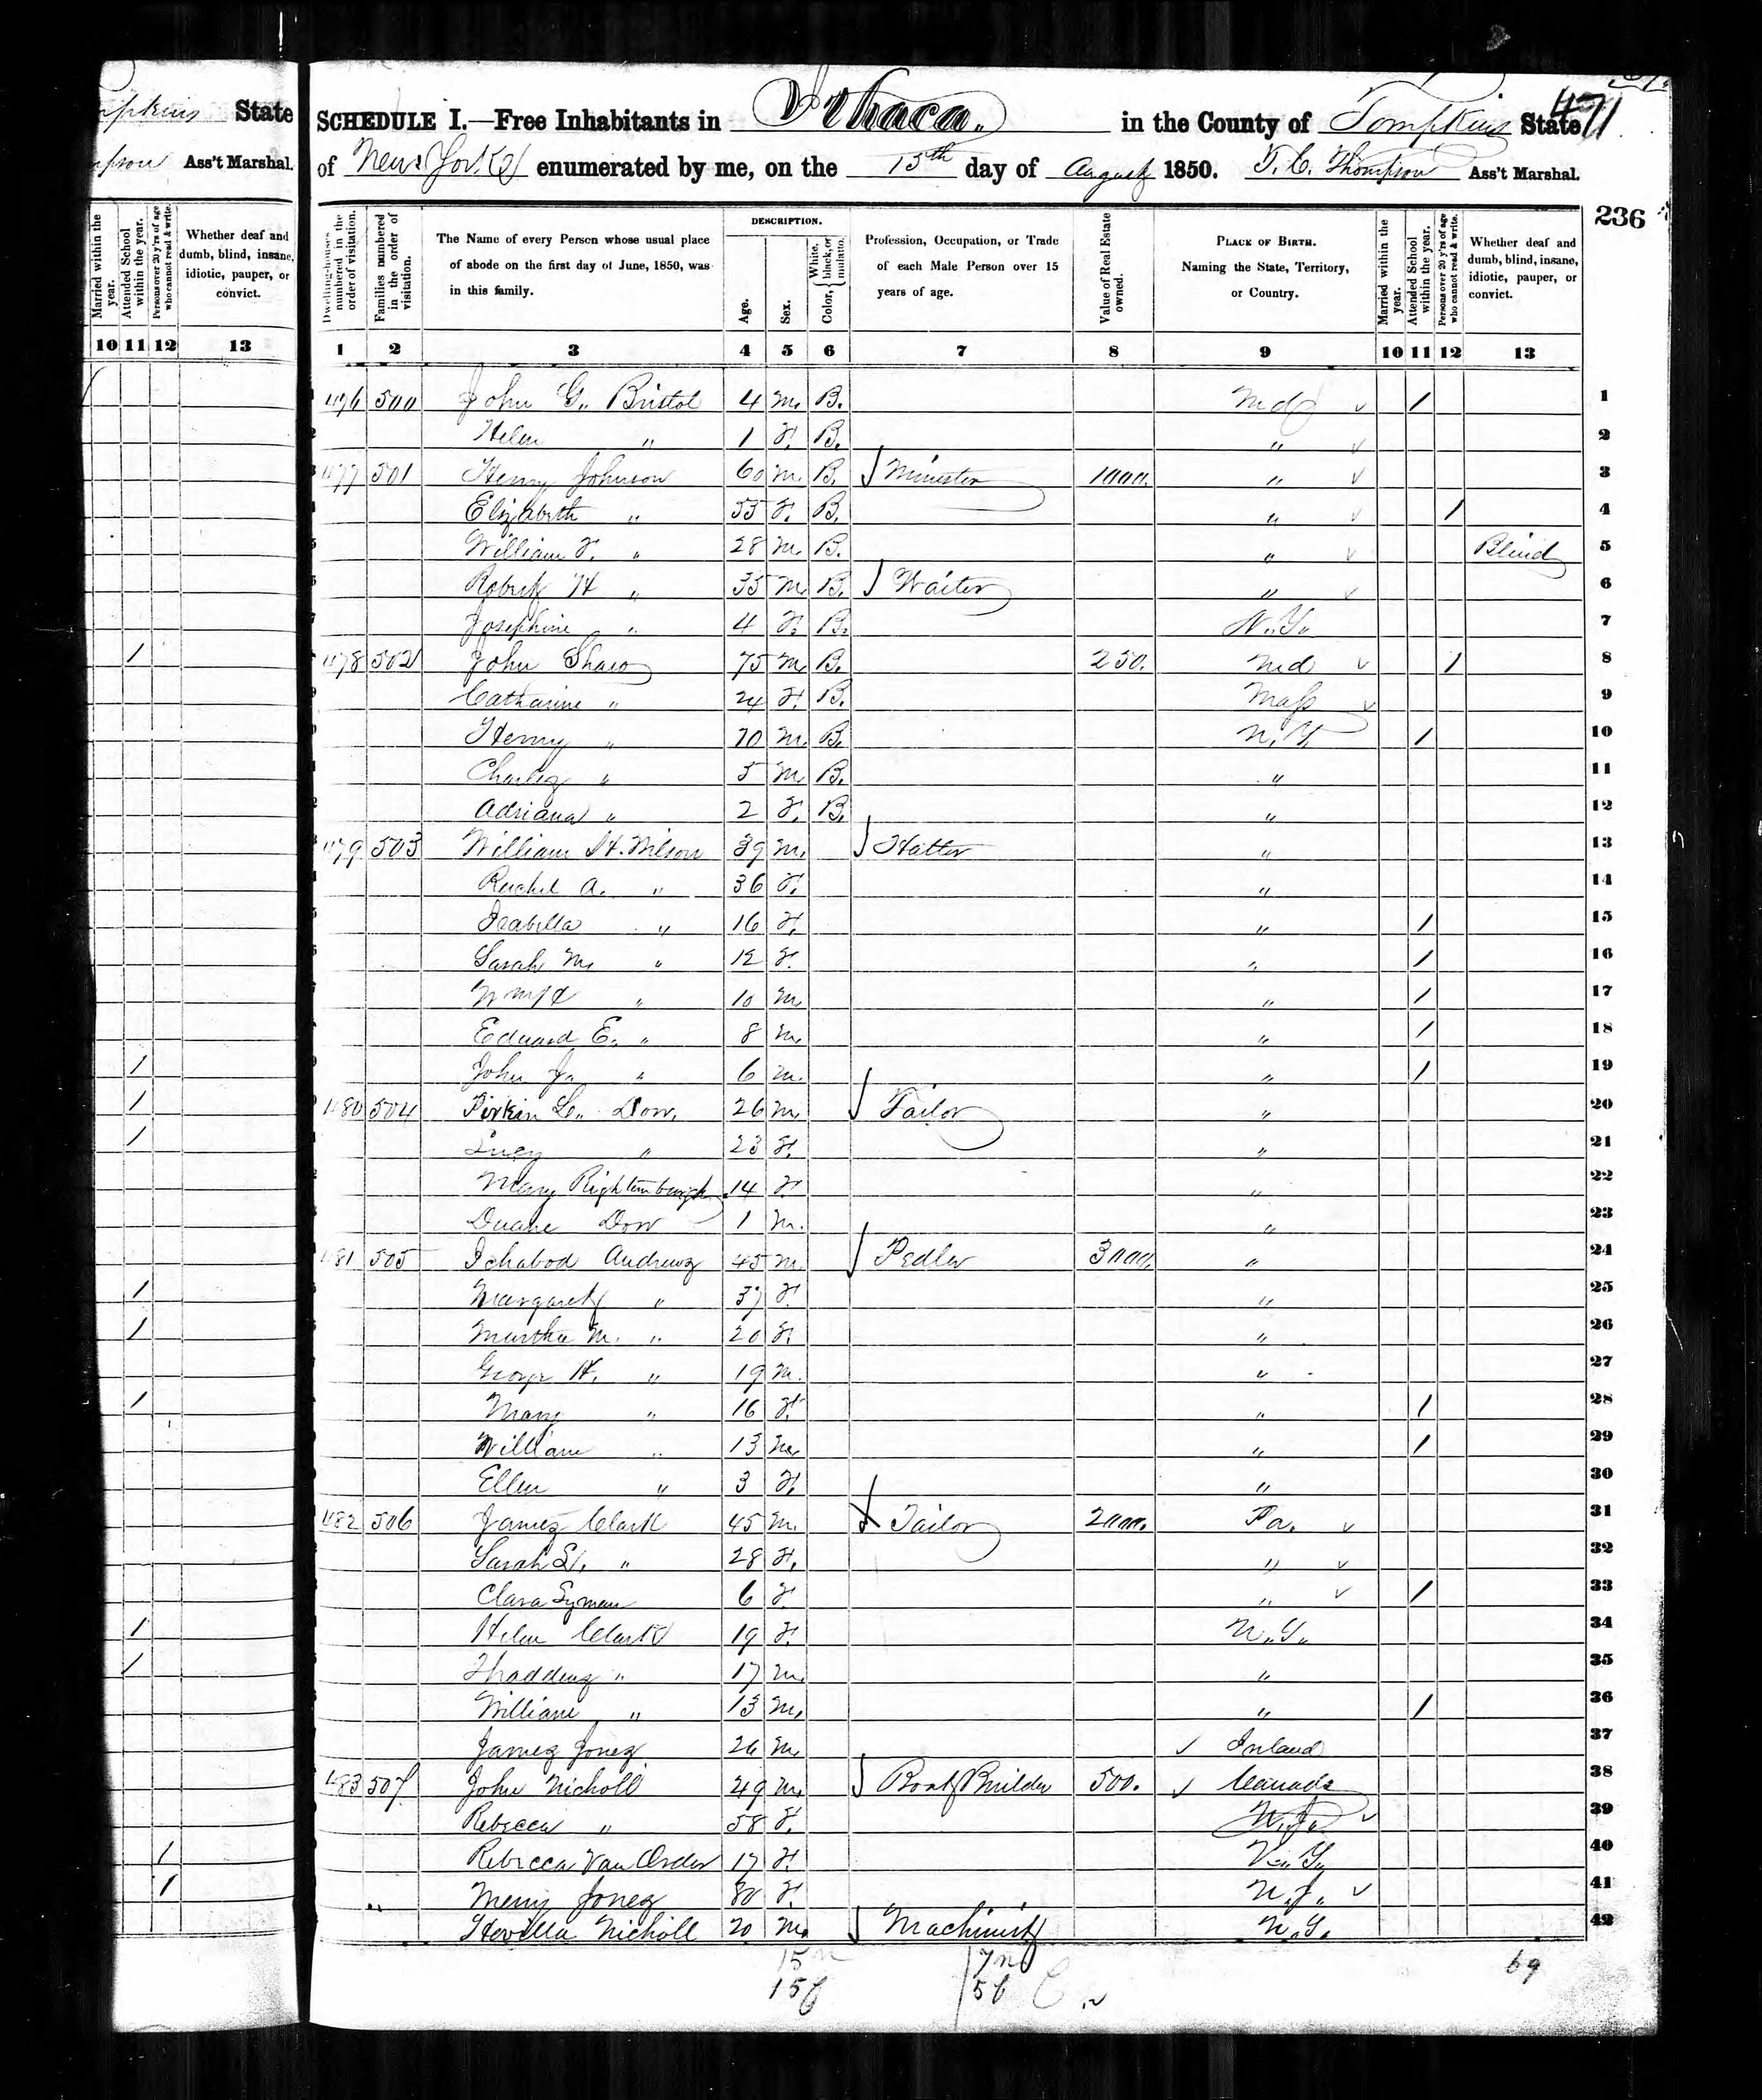
Above: 1850 census of Ithaca, showing the families of Henry Johnson and John Shaw. Image sourced from Ancestry.com.
Demographics by Municipality
1820-1870

Note: Enfield & Ithaca were part of Ulysses until 1821.
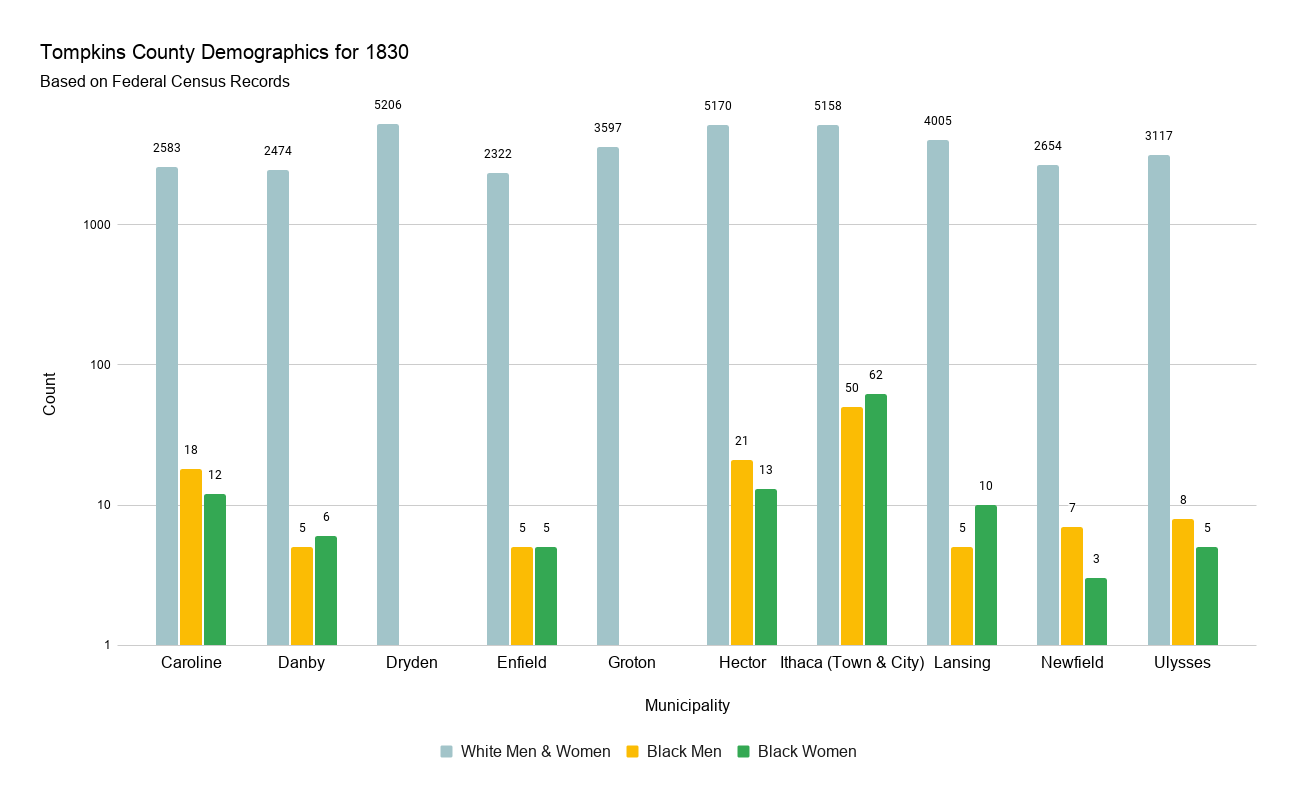
Note: The digital versions of the 1830 federal census records are poor, making it difficult to determine the number of white men vs. white women. Identifying the total, however, was easier. In time, this will be updated.


Ithaca’s Black Population Growth
1830-1870

Note: The census data as rendered on this graph indicates an increase in Ithaca's black population. Some of this increase may be the due to the passage of the Fugitive Slave Act of 1850. Another note: The digital versions of the 1830 federal census records are poor, making it difficult to determine the number of white men vs. white women. For this reason, they were left out but may be added in the future.
Note: The census data as rendered on this graph indicates an increase in Ithaca's black population. Some of this increase may be the due to the passage of the Fugitive Slave Act of 1850. Another note: The digital versions of the 1830 federal census records are poor, making it difficult to determine the number of white men vs. white women. For this reason, they were left out but may be added in the future.

Note: The census data as rendered on this here indicates an increase in Ithaca's black population. Some of this increase may be the due to the passage of the Fugitive Slave Act of 1850.
Black Birthplaces
1850-1870


Black Occupations
1850-1870